Project Gallery
The majority of projects shown here are team work. Subheadlines below the images indicate my contribution.
Image clicks lead to full article / project. List is ordered chronologically.
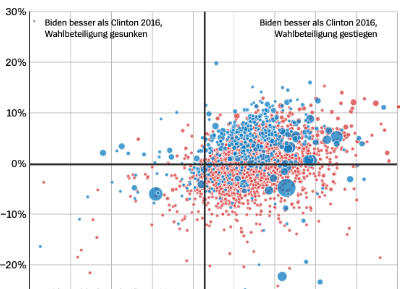
An even deeper divide - Analyzing the U.S. election
data analysis, dataviz, reporting
DER SPIEGEL
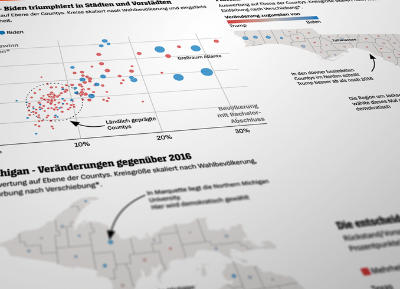
A close-up look at the election in 6 U.S. states
data analysis, dataviz
DER SPIEGEL
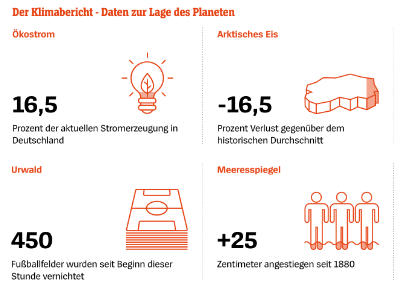
Climate change live dashboard for spiegel.de
research, methodology
DER SPIEGEL
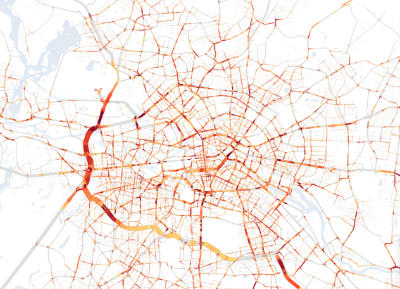
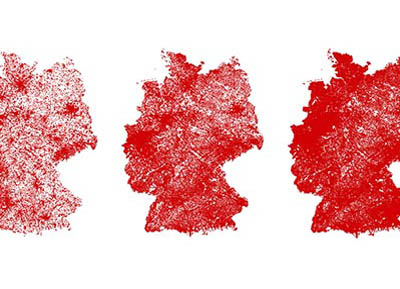
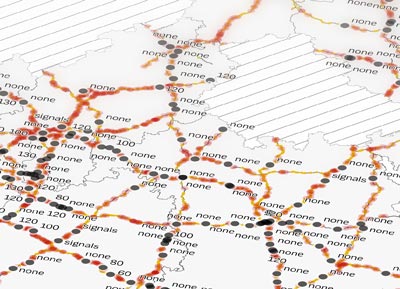
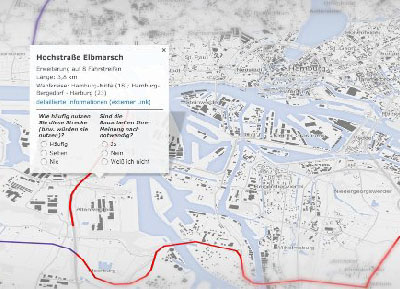
Mapping and analyzing traffic jams
analysis, interactive map, reporting
DER SPIEGEL

Beyond car-centric - A data driven investigation
data analysis, mapping, reporting
DER SPIEGEL
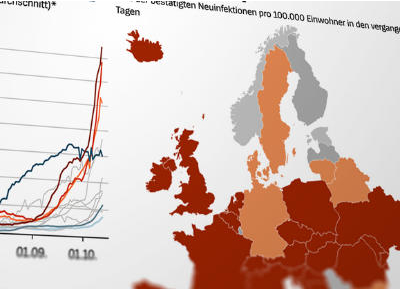
Covid-19 - The second wave hits Europe
data analysis, dataviz
DER SPIEGEL
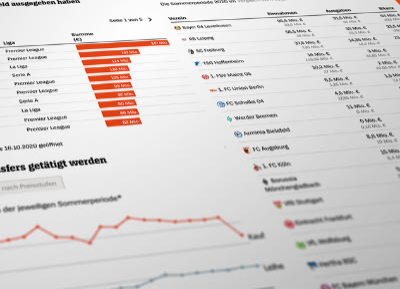
Coronavirus and the football transfer market
data analysis, dataviz, reporting
DER SPIEGEL
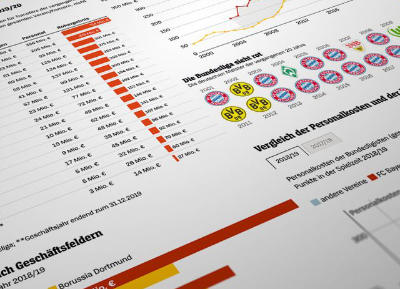
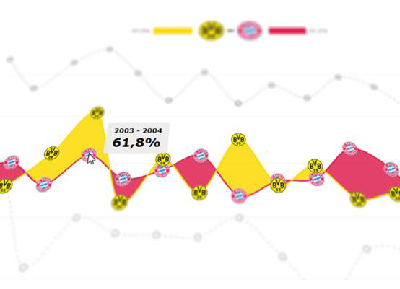
The financial dominance of Bayern München
data analysis, dataviz, reporting
DER SPIEGEL
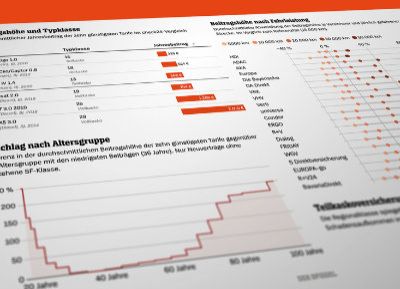
Investigating car insurance algorithms
data analysis, dataviz, reporting
DER SPIEGEL
Covid-19 - No, the rise in cases in not due to testing
data analysis, dataviz, reporting
DER SPIEGEL
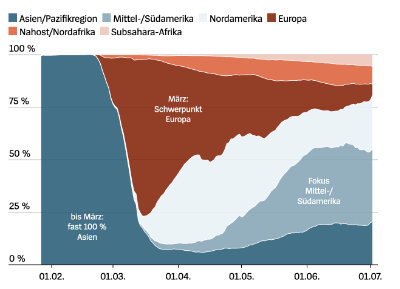
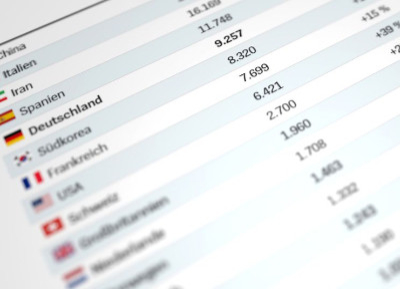
Covid-19 - Global comparison in numbers
data analysis, dataviz, reporting
DER SPIEGEL
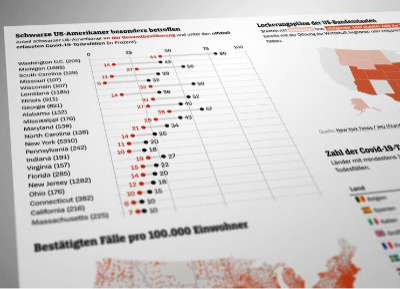
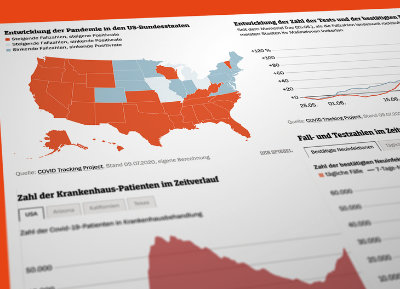
Covid-19 - The pandemic reaches the U.S.
data analysis, dataviz, reporting
DER SPIEGEL
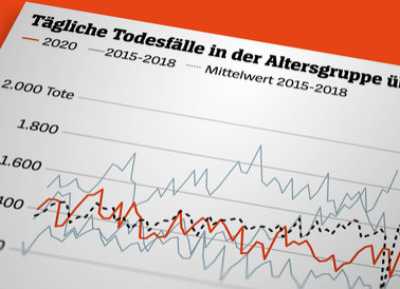
Covid-19 - No excess mortality in Germany?
data analysis, dataviz, reporting
DER SPIEGEL
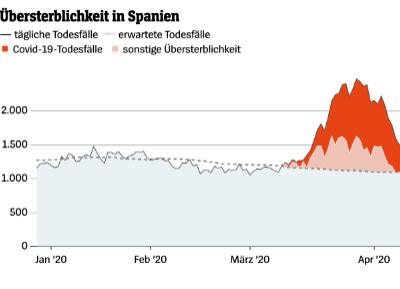
Codid-19 - A first look at excess mortality statistics
data analysis, dataviz, reporting
DER SPIEGEL
Covid-19 - International death figures in context
data analysis, dataviz, reporting
DER SPIEGEL
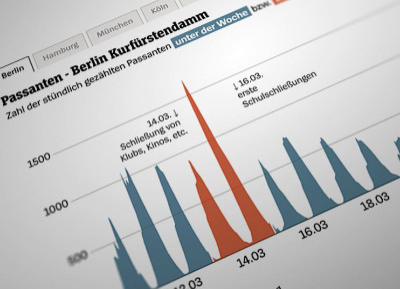
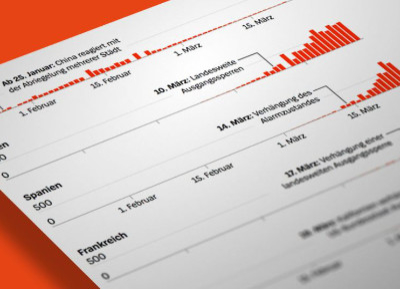
Reduced Mobility due to anti-corona measures?
scraping, analysis, dataviz, reporting
DER SPIEGEL
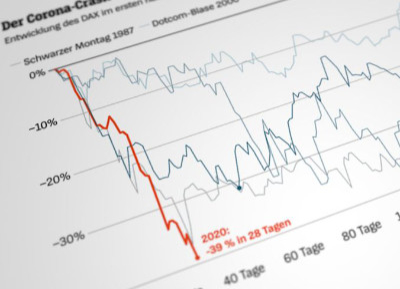
The fastest stock market crash in history
data analysis, dataviz
DER SPIEGEL
Covid-19 - Early analysis of severly affected countries
data analysis, dataviz, reporting
DER SPIEGEL
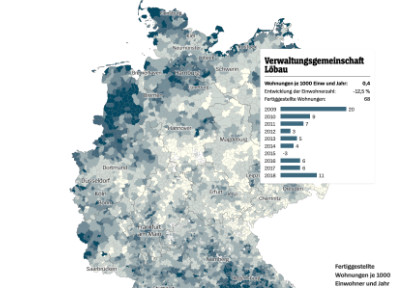
Regional trends on German housing markets
data analysis, mapping, reporting
DER SPIEGEL
The impact of setback rules for wind turbines
data analysis, dataviz, reporting
SPIEGEL ONLINE
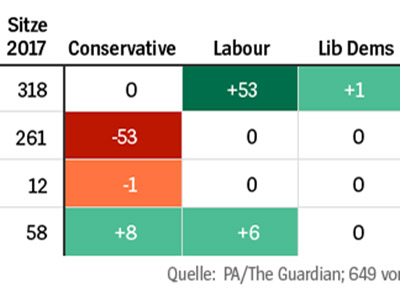
Analyzing the 2019 UK general election
dataviz, reporting
SPIEGEL ONLINE
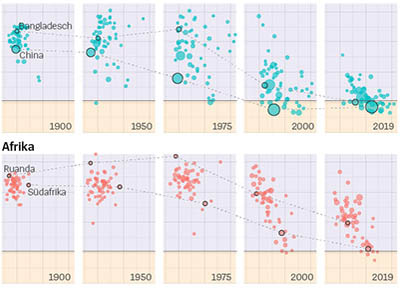
Why is the world population still increasing?
data analysis, dataviz, reporting
SPIEGEL ONLINE
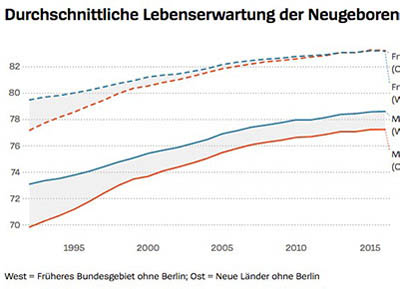
The health situation in East and West Germany
dataviz, reporting
SPIEGEL ONLINE
Analyzing four years of football free kicks
data analysis, dataviz, reporting
SPIEGEL ONLINE

Yet another record summer?
data analysis, dataviz, reporting
SPIEGEL ONLINE

A short history of urban design in Germany
reporting, mapping, storytelling
SPIEGEL ONLINE& DER SPIEGEL
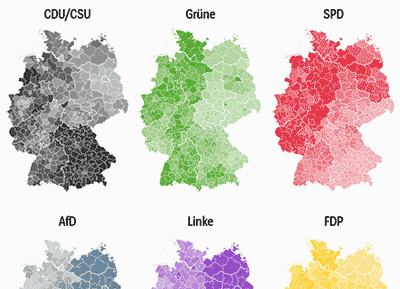
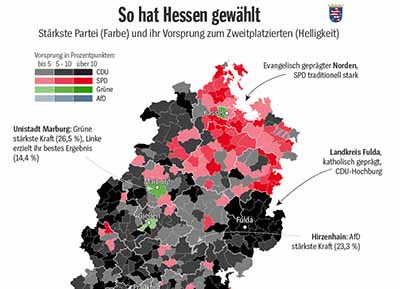
Analyzing EU election results for Germany
data processing, mapping
SPIEGEL ONLINE
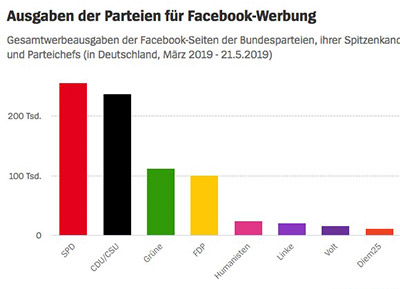
Political ad targeting on Facebook
data analysis, reporting
SPIEGEL ONLINE
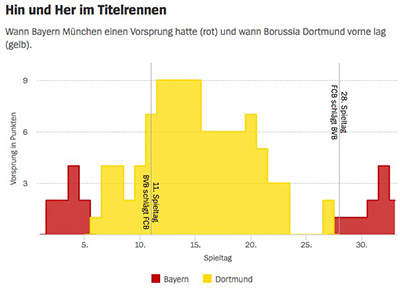
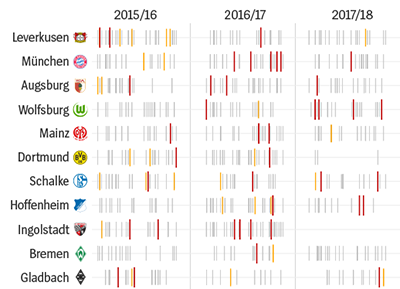
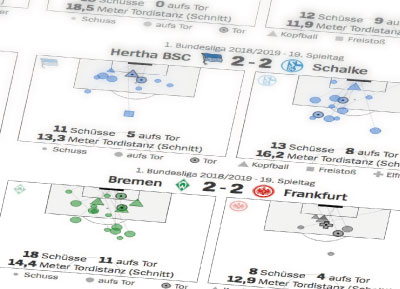
The Bundeslige title race 2018/2019
scraping, data processing & dataviz
SPIEGEL ONLINE
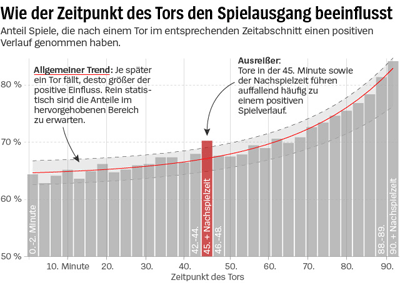
Are some goals worth more than others?
scraping, modeling, reporting
SPIEGEL ONLINE
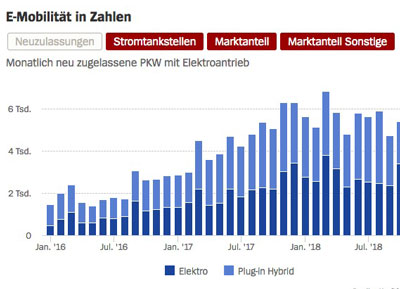
Key facts about e-mobility in Germany
scraping, data visualization series
SPIEGEL ONLINE
How many lives could be saved by a speed limit?
data processing & analysis, reporting
SPIEGEL ONLINE
Shot maps - Fully automated football dataviz
data processing, automated dataviz
SPIEGEL ONLINE
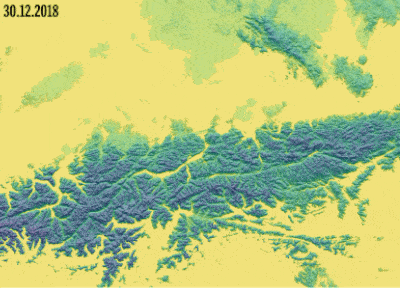
Visualizing snowfall accumulation in the Alps
dataviz on deadline
SPIEGEL ONLINE

Uncovering credit scoring in Germany
data analysis, reporting
SPIEGEL ONLINE

Friends and rivals in German football
data analysis, dataviz, storytelling
SPIEGEL ONLINE
Summing up state elections in a single map
data analysis, mapping
SPIEGEL ONLINE
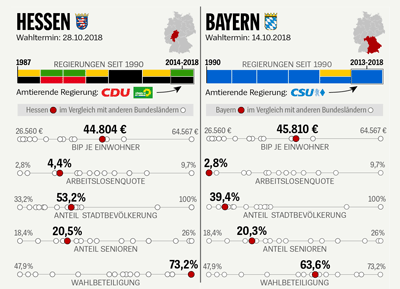
Data-driven infographics for state elections
data processing, automated dataviz
SPIEGEL ONLINE
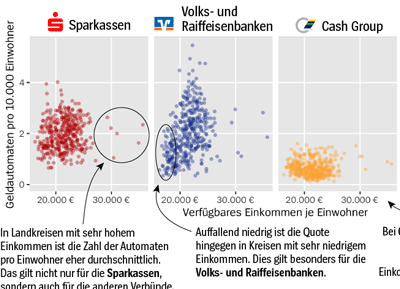
Analyzing the spatial distribution of ATMs
scraping, data analysis & visualization
SPIEGEL ONLINE
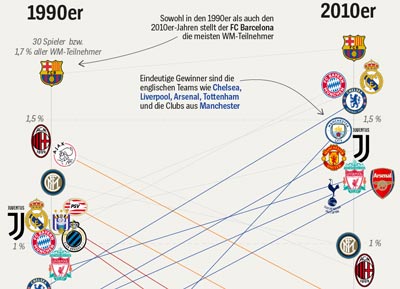
Analyzing all World Cup squads since 1930
scraping, analysis, dataviz & reporting
SPIEGEL ONLINE
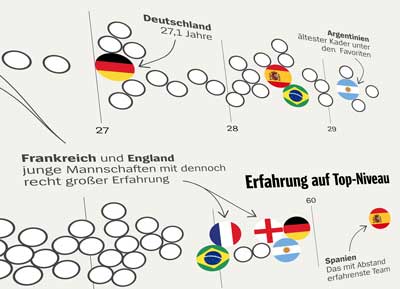
A data driven look at all World Cup 2018 squads
scraping, analysis, dataviz & reporting
SPIEGEL ONLINE
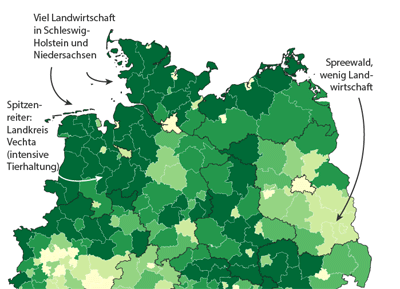
Mapping EU farm subsidies in Germany
mapping
SPIEGEL ONLINE
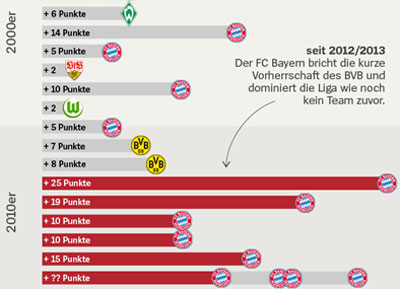
How Bayern Munich dominates the Bundesliga
scraping, data analysis & visualization
SPIEGEL ONLINE
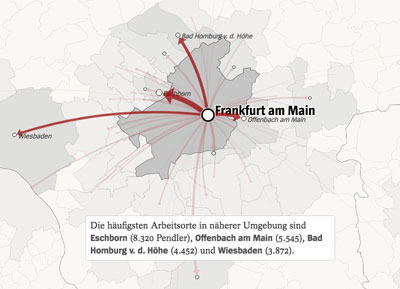
Commuting in Germany - a personalized story
scrollytelling, dynamic text & dataviz
SPIEGEL ONLINE
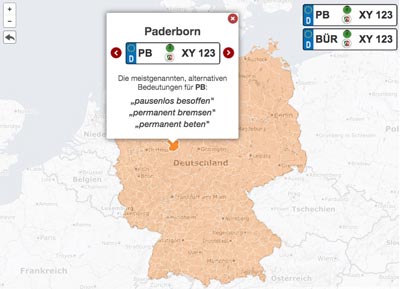
Crowdsourcing fictional number plates meanings
data collection and analysis
SPIEGEL ONLINE
Measuring and visualizing coach performances
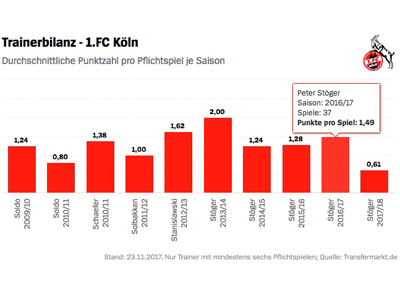
automated scraping + chart generation
SPIEGEL ONLINE
Unusual islands of political coalitions
data processing, map design
SPIEGEL ONLINE
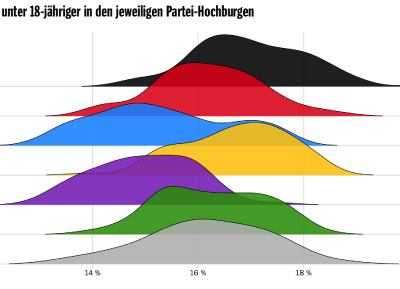
The socio-demography of party strongholds
data analysis, data visualization
SPIEGEL ONLINE
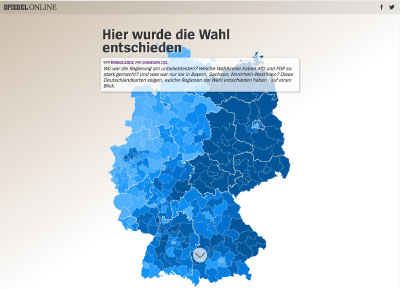
Explaining election results with animated maps
data analysis, mapping, storytelling
SPIEGEL ONLINE
Football inflation - a transfer market analysis
scraping, data analysis, reporting
SPIEGEL ONLINE
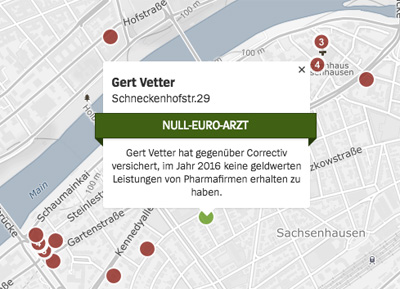
Euros for doctors 2016
data processing, data analysis, interactive map
SPIEGEL ONLINE+ CORRECT!V

The most timeless songs of the past decades
data processing, interactive dataviz
SPIEGEL ONLINE
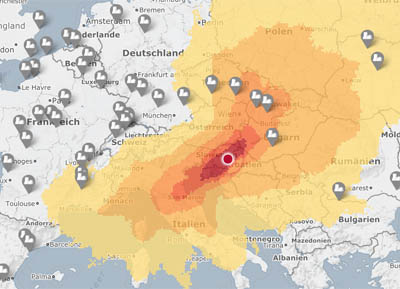
Mapping nuclear reactor risk in Europe
data processing, interactive map
SPIEGEL ONLINE

Measuring rental housing discimination
data processing, analysis, reporting
SPIEGEL ONLINE+ BR DATA
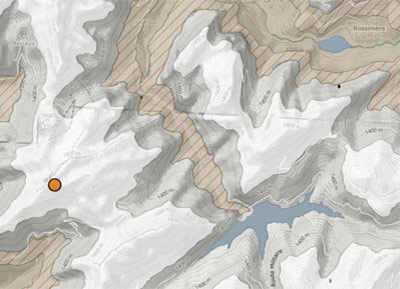
How global warming will affect alpine ski ressorts
data processing, interactive map
SPIEGEL ONLINE
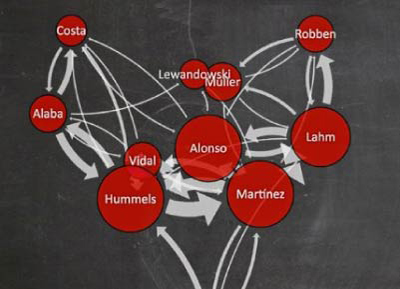
Visualizing football games with passmaps
data processing, automated dataviz
SPIEGEL ONLINE
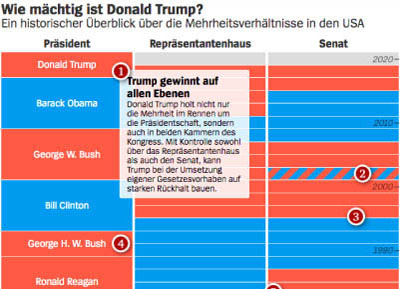
A visual history of political majorities in the US
dataviz, reporting
SPIEGEL ONLINE
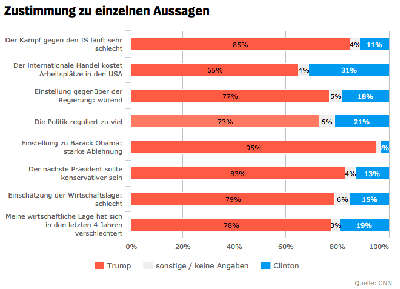
Analyzing the US presidential elections 2016
dataviz, mapping, reporting
SPIEGEL ONLINE
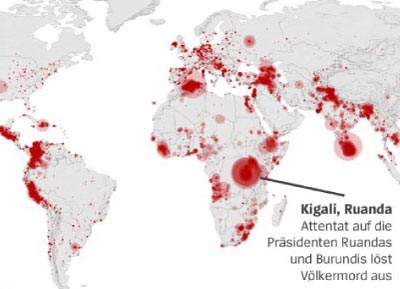
Terrorism since 1970 in a global perspective
dataviz, mapping, reporting
SPIEGEL ONLINE
What's wrong with the German census?
interactive maps
SPIEGEL ONLINE
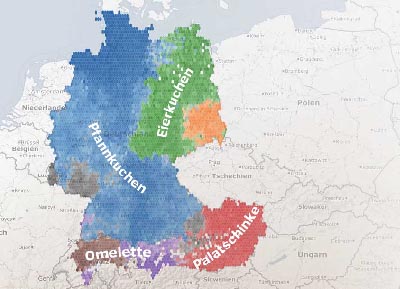
Mapping German dialects with crowd-sourced data
interactive map
SPIEGEL ONLINE+ SRF
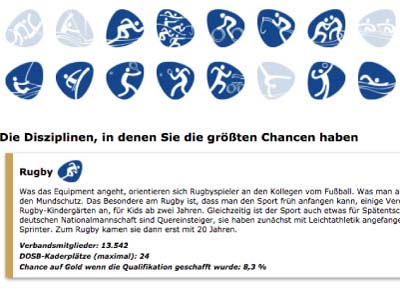
Your chances to win gold at the olympics
news game
SPIEGEL ONLINE
Euros for doctors
data wrangling, interactive map
SPIEGEL ONLINE+ CORRECT!V
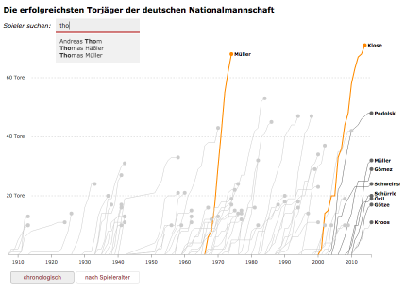
Top goal scorers of Germany national team
scraping, dataviz
SPIEGEL ONLINE
The market value of all EURO2016 players
scraping, dataviz, reporting
SPIEGEL ONLINE
The federal transport infrastructure plan
interactive map
SPIEGEL ONLINE
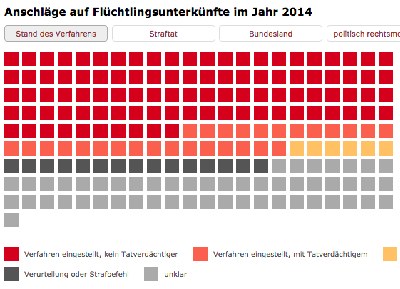
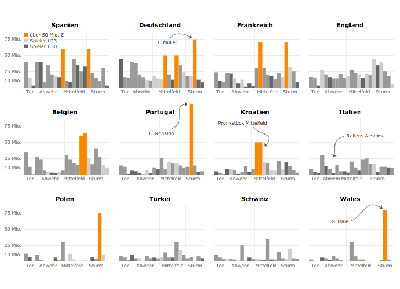
The rising number of attacks on refugees
dataviz
SPIEGEL ONLINE
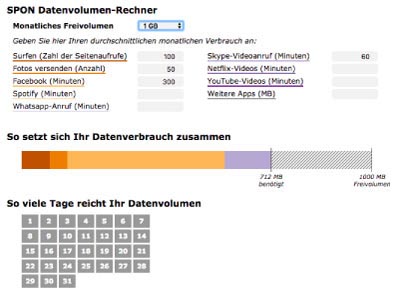
How much cell phone data do you need?
interactive calculator / dataviz
SPIEGEL ONLINE
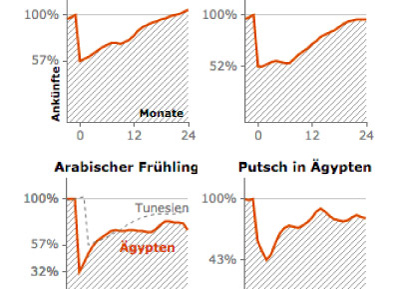
How terrorist attacks affect tourism
data processing, dataviz, reporting
SPIEGEL ONLINE
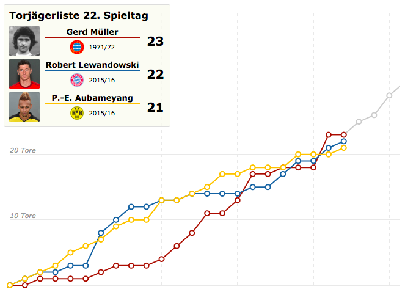
Chasing Gerd Müllers historic record
scraping, dataviz, reporting
SPIEGEL ONLINE
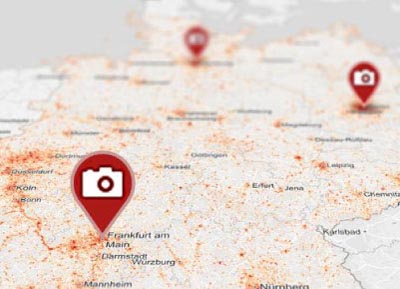
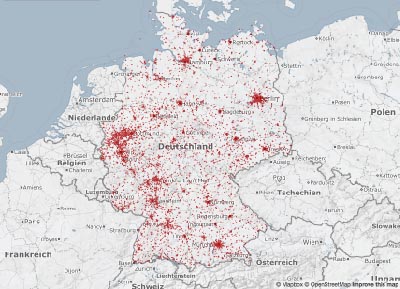
Analyzing flickr usage in Germany
static & interactive maps
SPIEGEL ONLINE
Messuring home field advantage in football
scraping, dataviz
SPIEGEL ONLINE
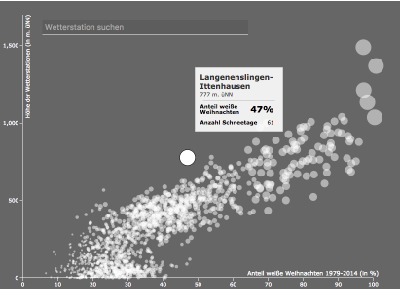
Probability of a white christmas in Germany
scraping, dataviz, mapping
SPIEGEL ONLINE
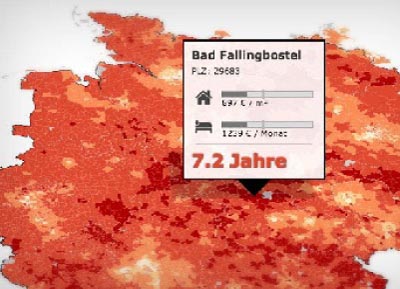
Home owners, retirement & financial security
data analysis, interactive map
SPIEGEL ONLINE

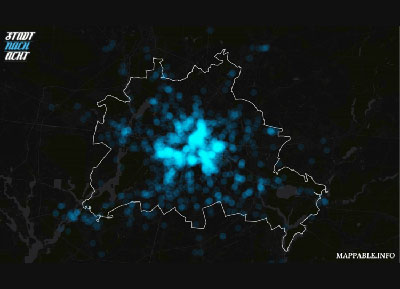
Spinning globe with glowing city markers
dataviz experiments
MAPPABLE.INFO
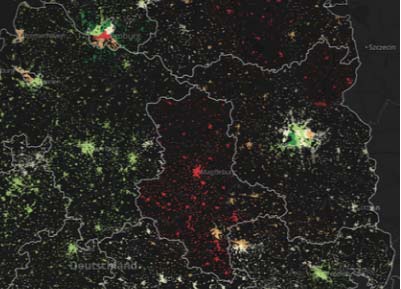
Mapping the night time economy
scraping, static maps
FREELANCE JOB
Adding interactivity to static maps
mapping experiments
FREELANCE JOB
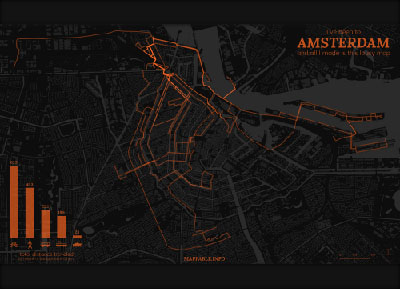
Tracking mobility during a short Amsterdam visit
static map
MAPPABLE.INFO
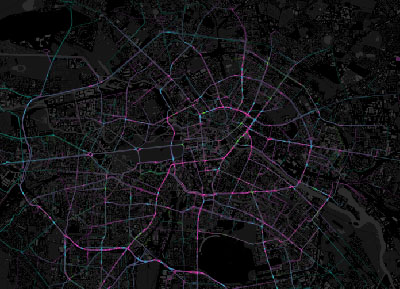
24h time-lapse of carsharing in Berlin
map with time-lapse animation
FREELANCE JOB
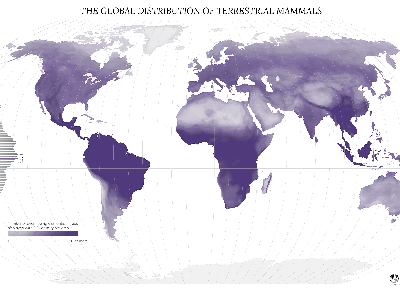
The global distribution of terrestrial mammals
static map
MAPPABLE.INFO
Travel Score - how much of the world have you seen?
interactive map, online service
MAPPABLE.INFO
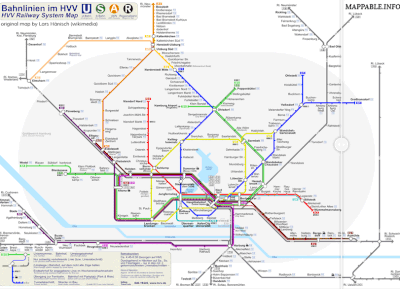
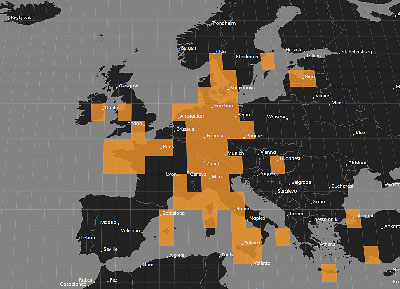
The limited accessibility of public transport
static maps, visual diff view
MAPPABLE.INFO
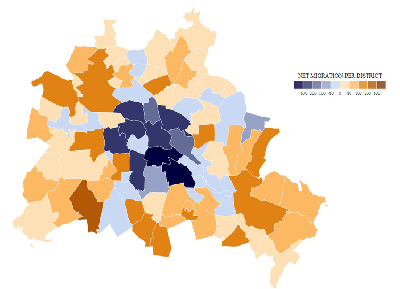
Berlin A-Z - mapping intra-city migration patterns
data mining, interactive map
MAPPABLE.INFO
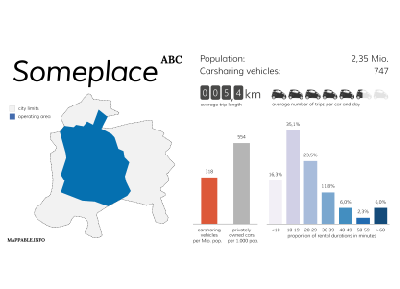
Analyzing and visualizing carsharing data
scraping, dataviz, mapping
MAPPABLE.INFO
The Geography of nonvoters in Germany
interactive map
MAPPABLE.INFO
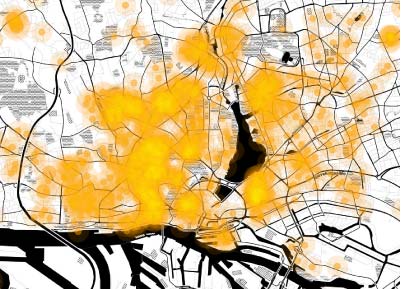
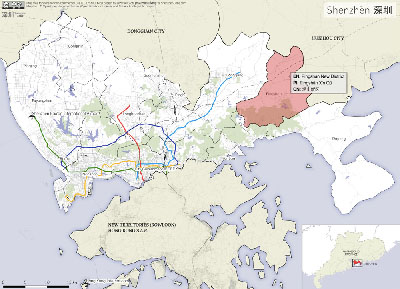
Mapping tourism in Hamburg
scraping, interactive map
MAPPABLE.INFO